Bar Chart · 柱状图#paired-bar#delta-arrow#percent-gain#three-panel#serif
TTRL · 3-panel paired bars with delta arrows on three benchmarks
TTRL · 三联配对柱图:基线 vs TTRL,三项基准的增益箭头
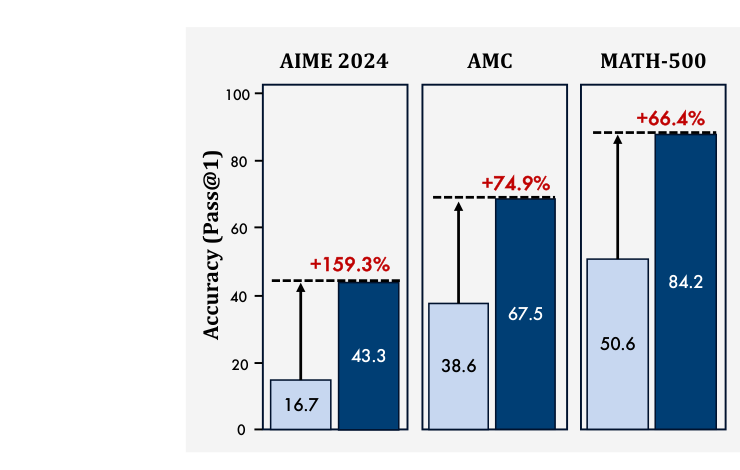
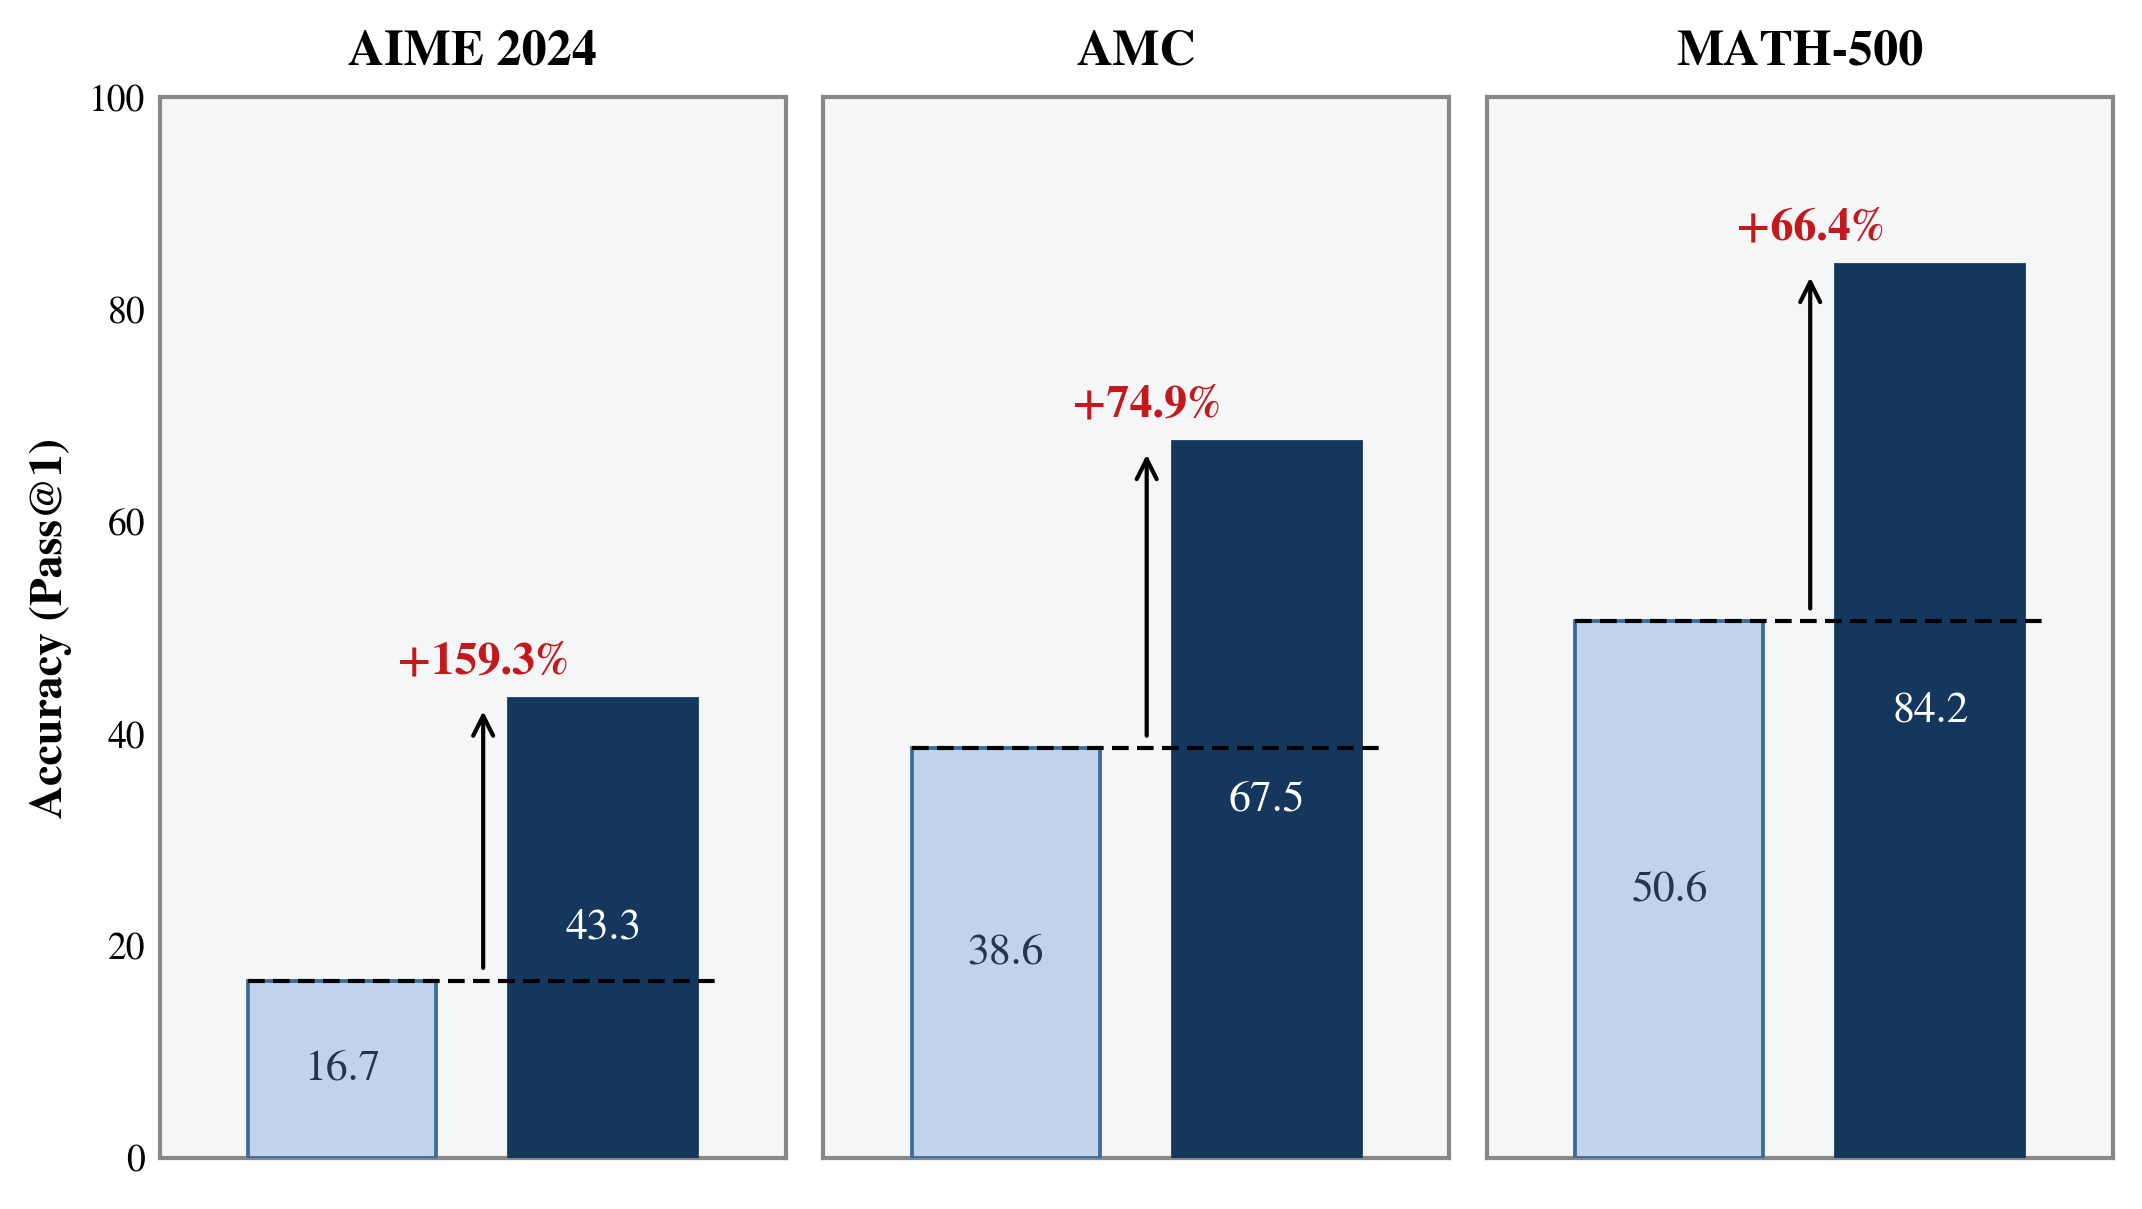
Reproduction of TTRL Figure 1. Three panels (AIME 2024 / AMC / MATH-500) on a shared y-axis, each showing the baseline pass@1 (light blue) versus the TTRL-trained model (dark navy). A black dashed line and arrow on each panel rise from the baseline level to the method top, with a bold red percent-gain label (+159.3% / +74.9% / +66.4%). Soft gray panel background, bold serif titles.
TTRL Figure 1 复现。共享 y 轴的三联面板(AIME 2024 / AMC / MATH-500),每面板浅蓝基线柱 vs 深海军蓝 TTRL 柱,黑虚线 + 箭头从基线高度爬到方法柱顶,红色加粗百分比增益标签(+159.3% / +74.9% / +66.4%)。柔灰背景面板,加粗 serif 面板标题。
@paper · 来自论文
TTRL: Test-Time Reinforcement Learning
TTRL:测试时强化学习
Yuxin Zuo et al. (Tsinghua University & Shanghai AI Lab) · NeurIPS 2025
// original from paper · 论文原图
// reproduced via ttrl_main_results.py · 脚本复现download png
ttrl_main_results.py
"""TTRL · Three-panel paired bars with delta arrows and percent gain labels.

Reproduction of TTRL Figure 1 (Performance and Position of TTRL).
Source: TTRL: Test-Time Reinforcement Learning, arXiv:2504.16084.

Each panel shows the pass@1 accuracy of a baseline (light blue) versus the
TTRL-trained model (dark blue) on one benchmark, with the relative gain
annotated in red above an arrow that climbs from the baseline level to the
method level.
"""

import matplotlib.pyplot as plt
import numpy as np

plt.rcParams.update({
    "font.family": "serif",
    "font.serif": ["STIXGeneral", "DejaVu Serif", "Times New Roman"],
    "mathtext.fontset": "stix",
})

COLOR_BASE = "#BFD4EA"
COLOR_TTRL = "#15375E"
COLOR_DELTA = "#C4191C"

PANELS = [
    {"title": "AIME 2024", "base": 16.7, "ttrl": 43.3, "gain": "+159.3%"},
    {"title": "AMC",       "base": 38.6, "ttrl": 67.5, "gain": "+74.9%"},
    {"title": "MATH-500",  "base": 50.6, "ttrl": 84.2, "gain": "+66.4%"},
]

fig, axes = plt.subplots(1, 3, figsize=(8.4, 4.6), sharey=True)
fig.subplots_adjust(wspace=0.06)

BAR_W = 0.36
ARROW_KW = dict(arrowstyle="->", color="black", lw=1.0, mutation_scale=12)

for ax, p in zip(axes, PANELS):
    base = p["base"]
    ttrl = p["ttrl"]

    ax.bar(0.0, base, width=BAR_W, color=COLOR_BASE,
           edgecolor="#3A6A9A", linewidth=0.9, zorder=3)
    ax.bar(0.5, ttrl, width=BAR_W, color=COLOR_TTRL,
           edgecolor=COLOR_TTRL, linewidth=0.9, zorder=3)

    ax.plot([-0.18, 0.5 + BAR_W / 2 + 0.04], [base, base],
            color="black", lw=1.0, ls=(0, (4, 2)), zorder=4)

    ax.annotate("", xy=(0.5 - BAR_W / 2 - 0.05, ttrl - 0.4),
                xytext=(0.5 - BAR_W / 2 - 0.05, base + 0.4),
                arrowprops=ARROW_KW, zorder=5)

    ax.text(0.5 - BAR_W / 2 - 0.05, ttrl + 1.5, p["gain"],
            color=COLOR_DELTA, ha="center", va="bottom",
            fontsize=11, fontweight="bold")

    ax.text(0.0, base / 2, f"{base:.1f}",
            color="#22364E", ha="center", va="center",
            fontsize=10.5, fontweight="normal")
    ax.text(0.5, ttrl / 2, f"{ttrl:.1f}",
            color="white", ha="center", va="center",
            fontsize=10.5, fontweight="normal")

    ax.set_title(p["title"], fontsize=12, fontweight="bold", pad=8)

    ax.set_xlim(-0.35, 0.85)
    ax.set_xticks([])

    ax.set_ylim(0, 100)
    ax.yaxis.set_major_locator(plt.MultipleLocator(20))

    for sp in ax.spines.values():
        sp.set_linewidth(1.0)
        sp.set_color("#888")
    ax.tick_params(length=0, labelsize=9)
    ax.grid(False)
    ax.set_facecolor("#F4F6F8")
    ax.set_axisbelow(True)

axes[0].set_ylabel("Accuracy (Pass@1)", fontsize=11, fontweight="bold")

plt.savefig("ttrl_main_results.png", dpi=300, bbox_inches="tight",
            facecolor="white")
plt.close()
print("saved: ttrl_main_results.png")