Scatter Plot · 散点图#broken-axis#pareto-frontier#multi-marker#shared-y
Meta-Harness · Broken-x-axis Pareto scatter with multi-marker legend
Meta-Harness · 折断 X 轴 Pareto 散点 + 多标记图例
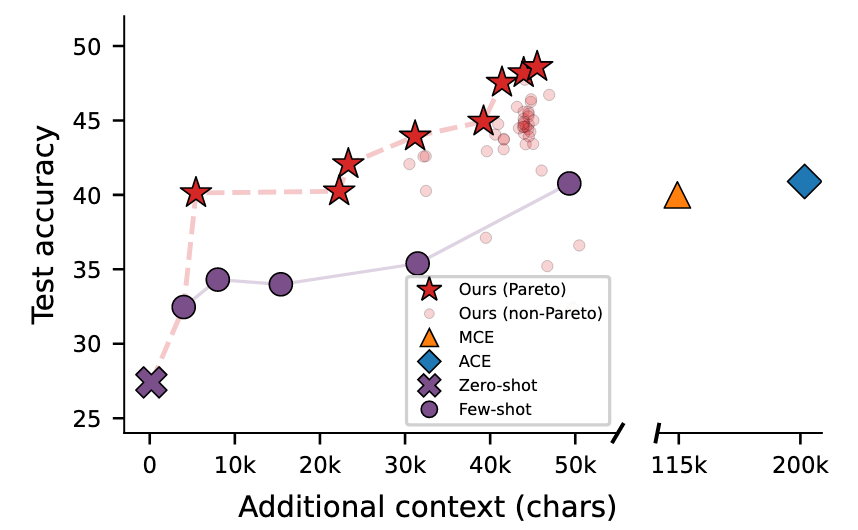
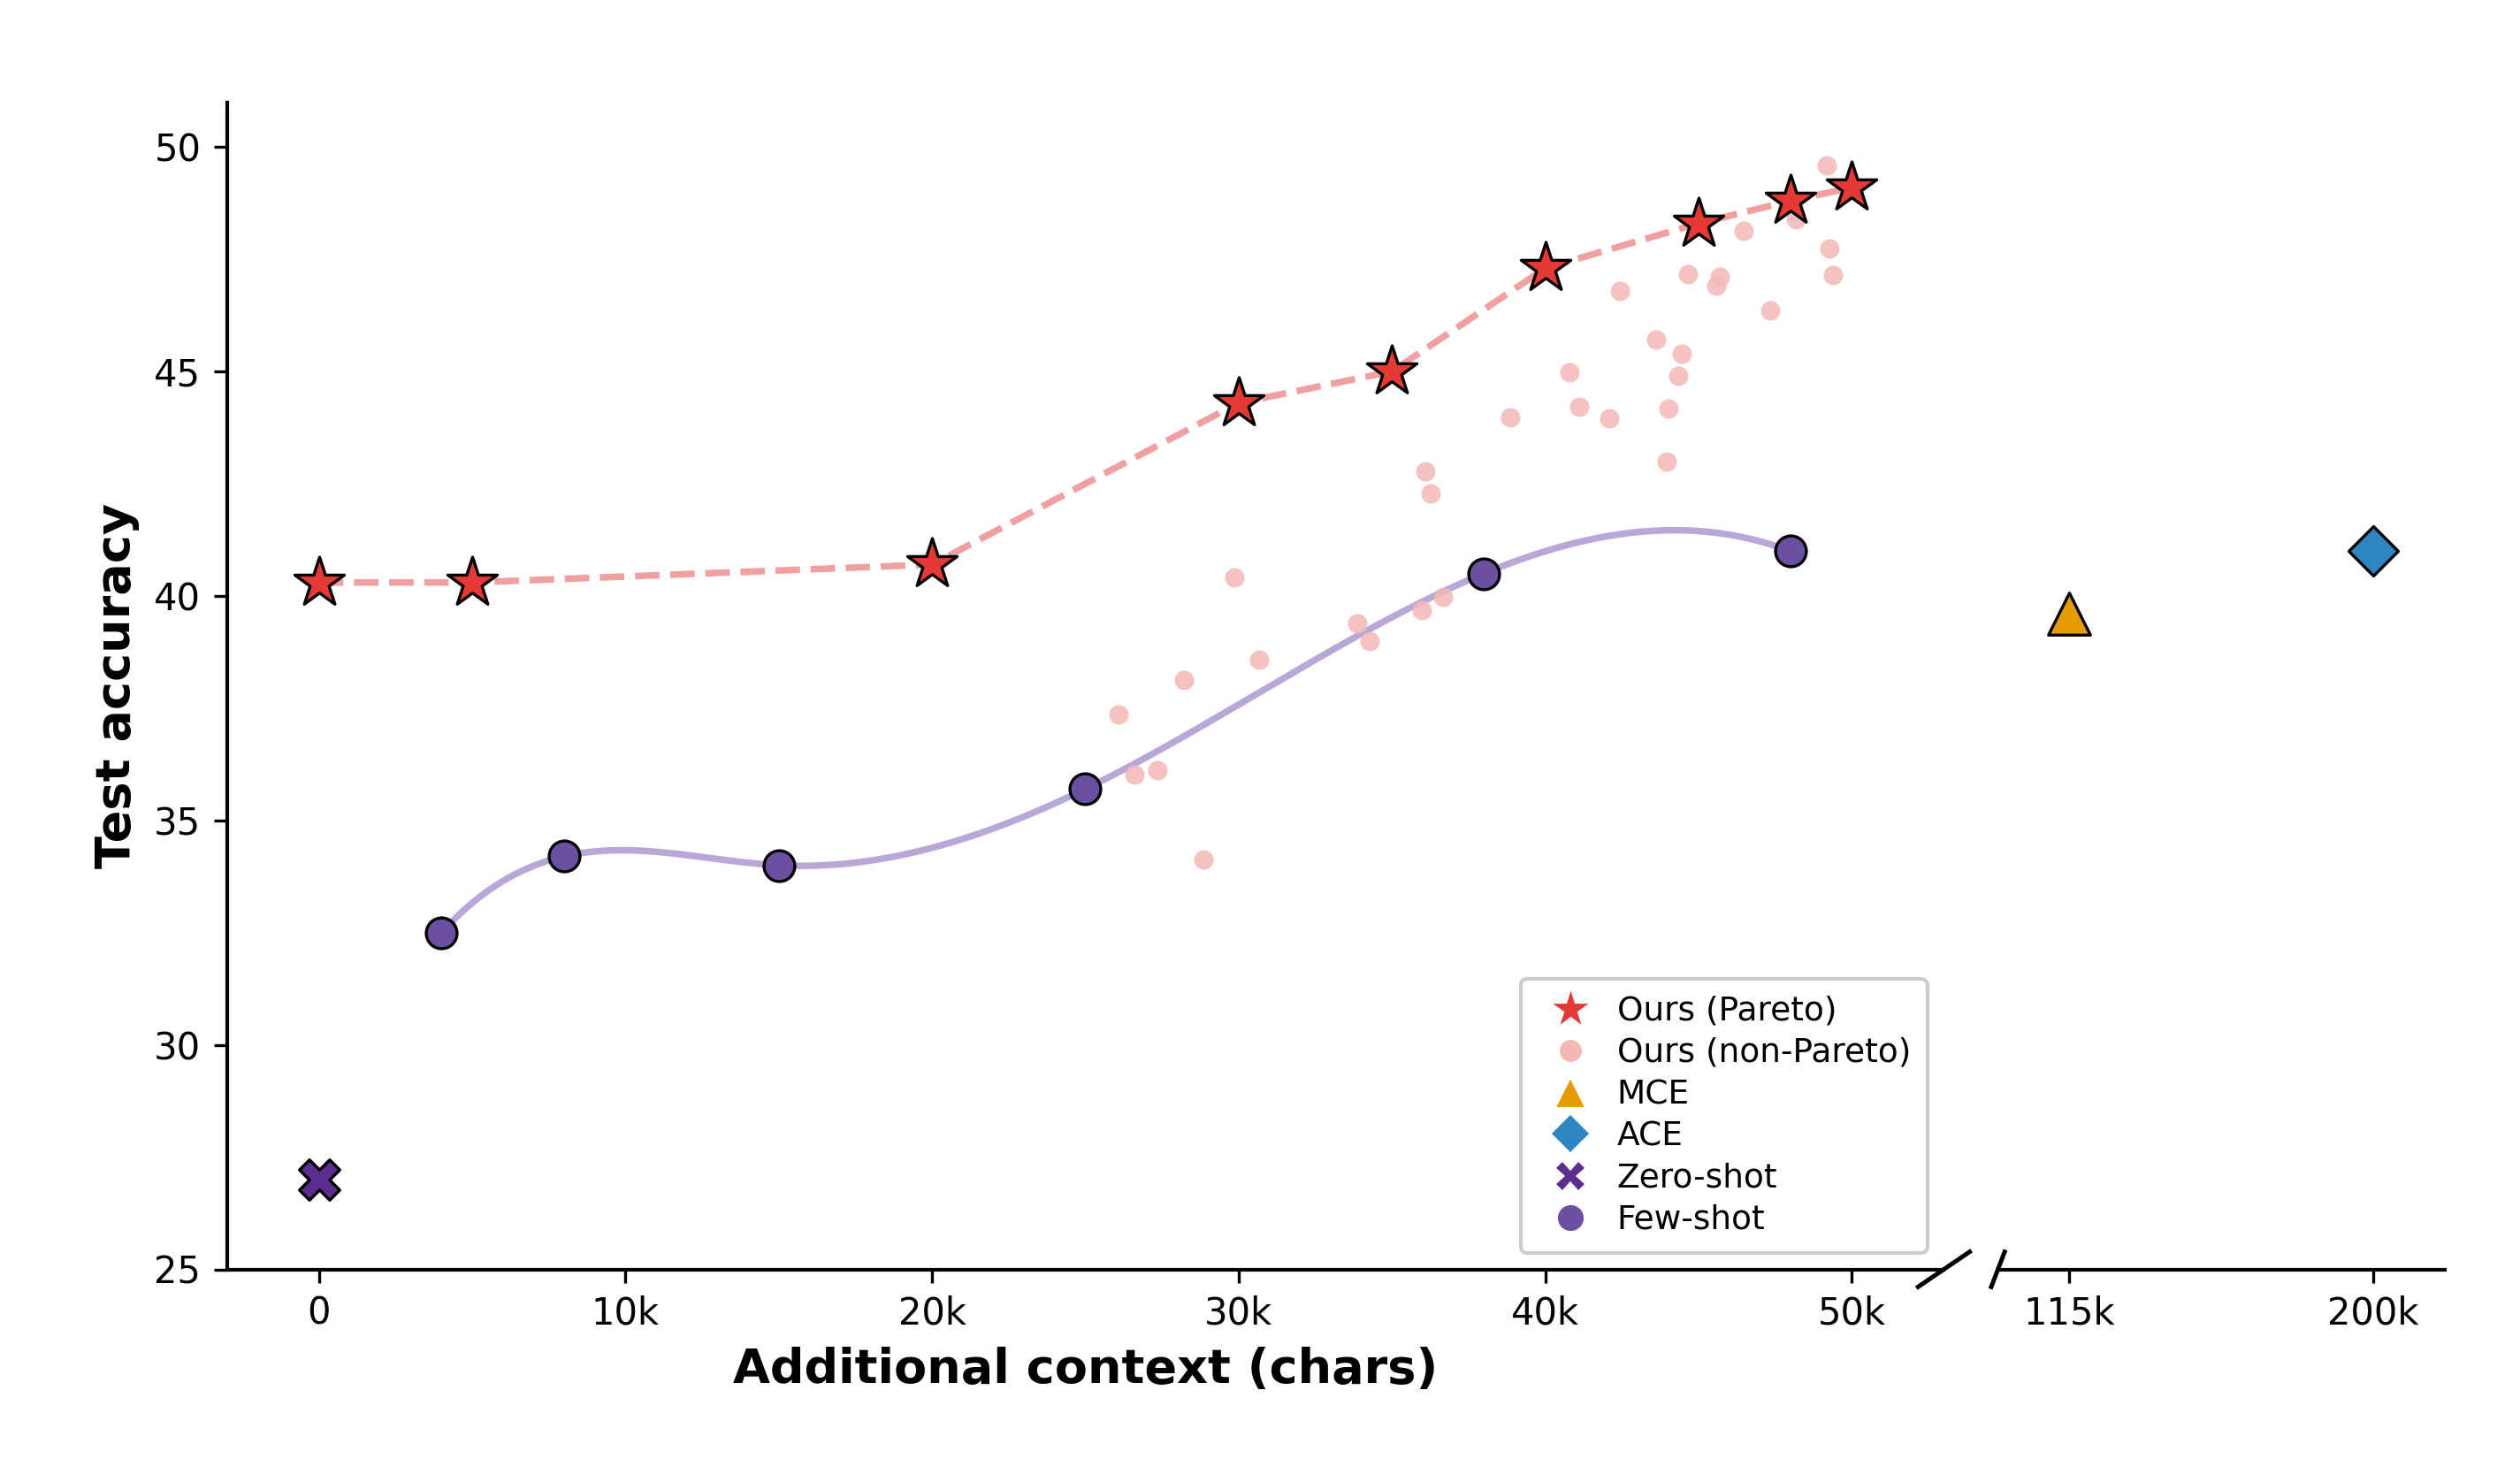
Two side-by-side panels sharing the y-axis. Left panel covers 0–50k characters with the Pareto frontier (red stars + pink dashed line), non-Pareto pink circles, a smooth few-shot spline (purple), and a deep-purple zero-shot ✕. Right panel keeps only 115k and 200k for MCE (orange ▲) and ACE (blue ◆). Break symbol drawn only on the bottom spine. Sans-serif bold axis labels, light-framed lower-right legend.
左右两面板共享 y 轴:左面板覆盖 0–50k characters,画 Pareto 前沿(红色 ★ + 粉色虚线)、非 Pareto 粉点、紫色 few-shot 平滑样条曲线、深紫 zero-shot ✕;右面板只保留 115k 与 200k,对应 MCE 橙 ▲ 和 ACE 蓝 ◆。折断符仅画在底部 spine。sans-serif 粗体轴标签,右下角浅边图例。
@paper · 来自论文
Meta-Harness: End-to-End Optimization of Model Harnesses
Meta-Harness:模型 Harness 的端到端优化
Yoonho Lee et al. (Stanford IRIS Lab) · arXiv 2026
// original from paper · 论文原图
// reproduced via scatter_break.py · 脚本复现download png
scatter_break.py
"""
Reproduce: image9.png — Broken-axis scatter plot (Meta-Harness style)
X-axis has a break between ~50k and 115k.
Uses two side-by-side axes with shared y-axis.
"""

import numpy as np
import matplotlib.pyplot as plt
import matplotlib.patches as mpatches
import matplotlib.lines as mlines
from scipy.interpolate import make_interp_spline

plt.rcParams.update({
    'font.family': 'sans-serif',
    'font.sans-serif': ['DejaVu Sans', 'Arial', 'Helvetica'],
    'text.usetex': False,
})

# ---- 模拟数据 ----
rng = np.random.default_rng(42)

# Ours (Pareto) — red stars + dashed pink line
pareto_x = np.array([0, 5000, 20000, 30000, 35000, 40000, 45000, 48000, 50000])
pareto_y = np.array([40.3, 40.3, 40.7, 44.3, 45.0, 47.3, 48.3, 48.8, 49.1])

# Ours (non-Pareto) — scattered light-pink circles
np_x = rng.uniform(25000, 50000, 32)
np_y = 35 + 14 * (np_x - 25000) / 25000 + rng.normal(0, 1.8, 32)
np_y = np.clip(np_y, 34, 50)

# Few-shot — purple circles + straight line (折线,非样条)
few_x = np.array([4000, 8000, 15000, 25000, 38000, 48000])
few_y = np.array([32.5, 34.2, 34.0, 35.7, 40.5, 41.0])

# Zero-shot — single purple X at origin
zs_x, zs_y = 0, 27.0

# MCE — orange triangle (right panel)
mce_x, mce_y = 115000, 39.6

# ACE — blue diamond (right panel)
ace_x, ace_y = 200000, 41.0


# ---- 颜色 ----
C_PARETO   = '#E53935'   # 亮红(与原图一致)
C_NONPARETO= '#F4B8B8'   # 更淡的粉雾
C_FEW      = '#6B4FA0'   # 深紫
C_FEW_LINE = '#B8A8D8'   # 浅紫(曲线)
C_MCE      = '#E69B00'   # 橙色
C_ACE      = '#2E86C1'   # 蓝色
C_ZS       = '#5B2D8E'   # 深紫(zero-shot)
C_DASH     = '#F0A0A0'   # 粉色虚线

# ---- 布局:左宽(0-50k)右窄(115k, 200k)----
fig, (ax1, ax2) = plt.subplots(
    1, 2,
    figsize=(9.5, 5.5),
    gridspec_kw={'width_ratios': [5, 1.3], 'wspace': 0.05},
)
fig.subplots_adjust(left=0.09, right=0.97, top=0.93, bottom=0.13)

YLIM = (25, 51)

for ax in [ax1, ax2]:
    ax.set_ylim(*YLIM)

# ---- 左轴(ax1:0 - 50k)----
ax1.set_xlim(-3000, 53000)

# Few-shot 样条曲线(原图明显为 S 形平滑曲线)
spl = make_interp_spline(few_x, few_y, k=3)
spl_x = np.linspace(few_x[0], few_x[-1], 300)
spl_y = spl(spl_x)
ax1.plot(spl_x, spl_y, color=C_FEW_LINE, lw=1.8, zorder=2)
ax1.scatter(few_x, few_y,
            marker='o', s=70, color=C_FEW,
            zorder=4, linewidths=0.8, edgecolors='black')

# Zero-shot X
ax1.scatter([zs_x], [zs_y], marker='X', s=120, color=C_ZS, zorder=5,
            linewidths=0.8, edgecolors='black')

# non-Pareto circles(淡粉,无描边)
ax1.scatter(np_x, np_y, marker='o', s=28, color=C_NONPARETO, alpha=0.85,
            zorder=3, linewidths=0)

# Pareto dashed line + stars
ax1.plot(pareto_x, pareto_y, color=C_DASH, lw=1.8, linestyle='--', zorder=3)
ax1.scatter(pareto_x, pareto_y,
            marker='*', s=200, color=C_PARETO,
            zorder=5, linewidths=0.8, edgecolors='black')

ax1.set_xlabel('Additional context (chars)', fontsize=13, fontweight='bold', labelpad=4)
ax1.set_ylabel('Test accuracy', fontsize=13, fontweight='bold')
ax1.set_xticks([0, 10000, 20000, 30000, 40000, 50000])
ax1.set_xticklabels(['0', '10k', '20k', '30k', '40k', '50k'], fontsize=10)
ax1.tick_params(labelsize=10)

# spines: 左/下
ax1.spines['top'].set_visible(False)
ax1.spines['right'].set_visible(False)
ax1.spines['left'].set_linewidth(1.0)
ax1.spines['bottom'].set_linewidth(1.0)

# ---- 右轴(ax2:115k, 200k)----
ax2.set_xlim(95000, 220000)

ax2.scatter([mce_x], [mce_y], marker='^', s=130, color=C_MCE, zorder=5,
            linewidths=0.8, edgecolors='black')
ax2.scatter([ace_x], [ace_y], marker='D', s=90, color=C_ACE, zorder=5,
            linewidths=0.8, edgecolors='black')

ax2.set_xticks([115000, 200000])
ax2.set_xticklabels(['115k', '200k'], fontsize=10)
ax2.tick_params(labelsize=10)
ax2.set_yticks([])

# spines: 只保留下边
ax2.spines['top'].set_visible(False)
ax2.spines['right'].set_visible(False)
ax2.spines['left'].set_visible(False)
ax2.spines['bottom'].set_linewidth(1.0)

# ---- 折断符号(只在 x 轴底部,不在顶部)----
d = 0.015
kwargs = dict(transform=ax1.transAxes, color='k', clip_on=False, lw=1.2)
ax1.plot((1 - d, 1 + d), (-d, +d), **kwargs)   # 底部斜杠

kwargs2 = dict(transform=ax2.transAxes, color='k', clip_on=False, lw=1.2)
ax2.plot((-d, +d), (-d, +d), **kwargs2)         # 底部斜杠

# ---- 图例(右下角,有浅灰框)----
legend_elements = [
    mlines.Line2D([], [], marker='*', color='w', markerfacecolor=C_PARETO,
                  markersize=11, label='Ours (Pareto)',
                  linestyle='--', linewidth=1.2,
                  markeredgewidth=0.3, markeredgecolor='white'),
    mlines.Line2D([], [], marker='o', color='w', markerfacecolor=C_NONPARETO,
                  markersize=7, label='Ours (non-Pareto)', linestyle='None'),
    mlines.Line2D([], [], marker='^', color='w', markerfacecolor=C_MCE,
                  markersize=9, label='MCE', linestyle='None'),
    mlines.Line2D([], [], marker='D', color='w', markerfacecolor=C_ACE,
                  markersize=8, label='ACE', linestyle='None'),
    mlines.Line2D([], [], marker='X', color='w', markerfacecolor=C_ZS,
                  markersize=9, label='Zero-shot', linestyle='None'),
    mlines.Line2D([], [], marker='o', color='w', markerfacecolor=C_FEW,
                  markersize=8, label='Few-shot', linestyle='None'),
]

leg = ax1.legend(
    handles=legend_elements,
    loc='lower right',
    fontsize=9.0,
    frameon=True,
    facecolor='white',
    edgecolor='#CCCCCC',
    framealpha=1.0,
    borderpad=0.5,
    labelspacing=0.3,
    handletextpad=0.4,
)

fig.savefig(
    'scatter_break_repro.png',
    dpi=300, facecolor='white',
)
plt.close(fig)
print('saved: scatter_break_repro.png')