Line Chart · 折线图#small-multiples#training-curve#per-panel-y-scale#times-new-roman
PreRL · 1×4 line panels of cognitive-behavior counts vs step
PreRL · 1×4 折线面板:认知行为计数 vs 训练步数
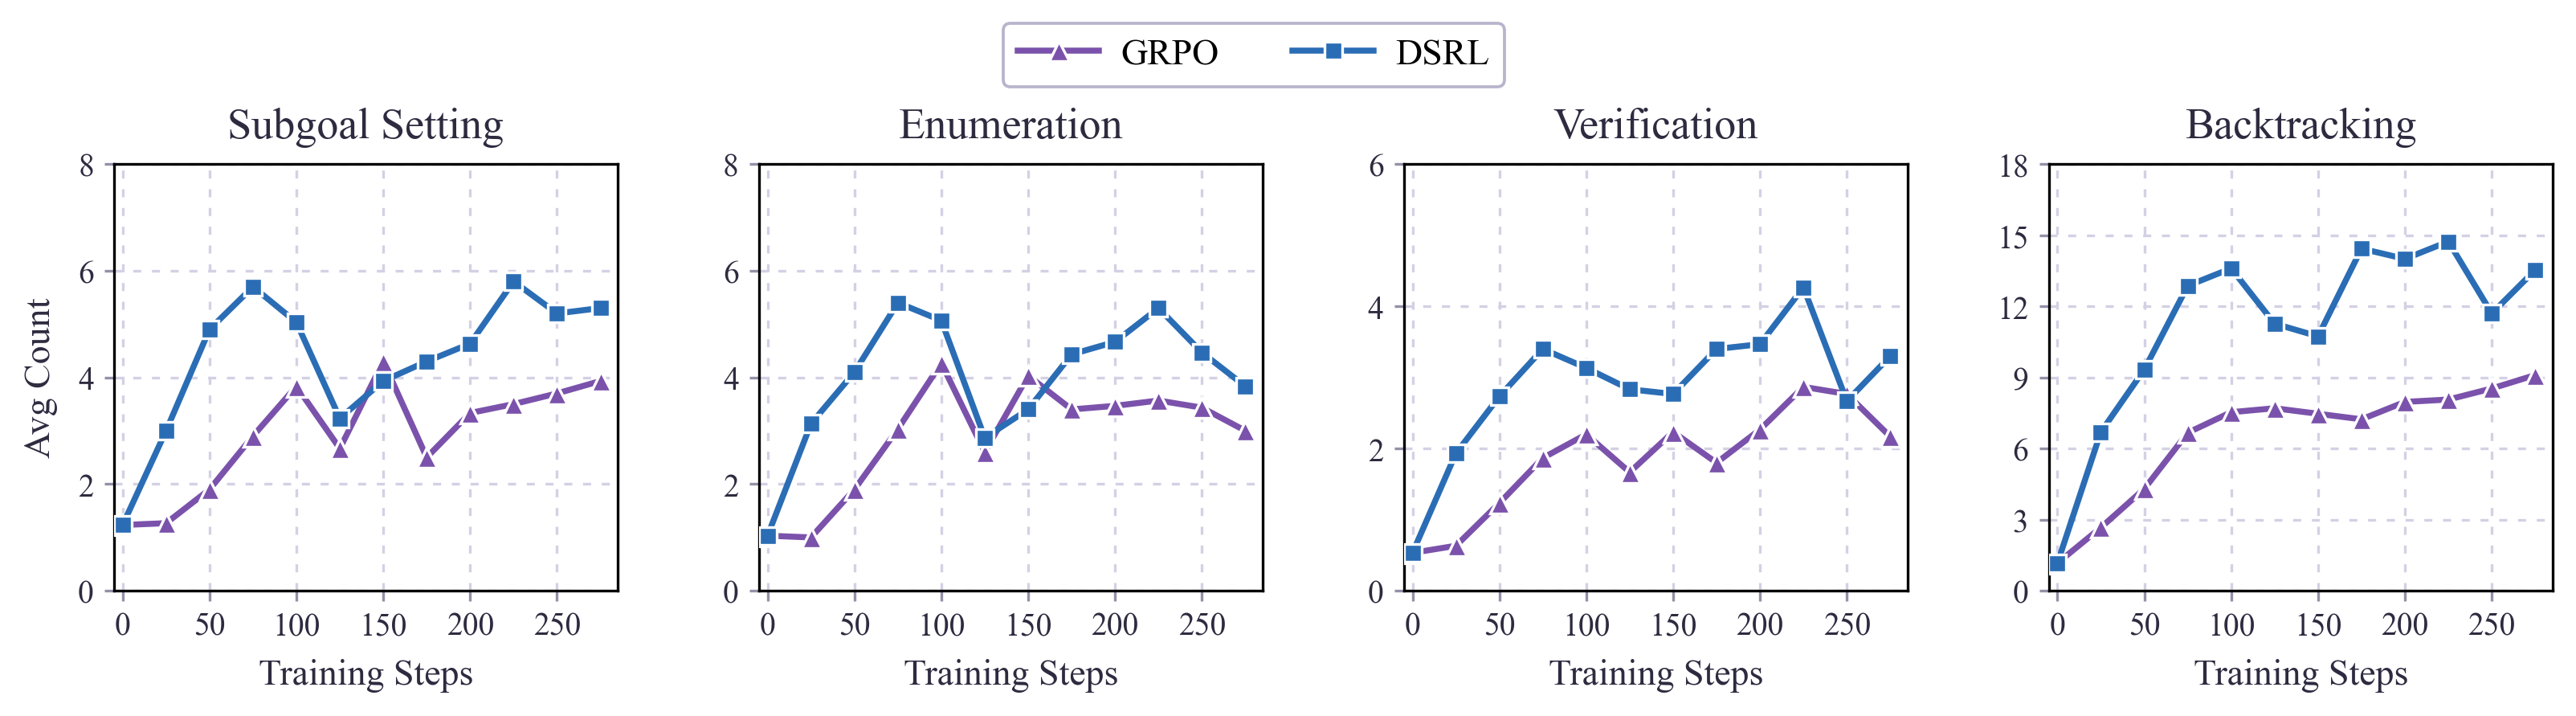
1×4 horizontal line panels comparing two RL methods (DSRL vs GRPO) across four chain-of-thought behaviors: Subgoal Setting, Enumeration, Verification, Backtracking. Per-panel y-scale (0–8 / 0–8 / 0–6 / 0–18). Square markers (DSRL, navy), triangle markers (GRPO, purple), white marker edge, dotted purple-grey grid, Times New Roman serif. Top-centre frameless legend.
1×4 横向折线面板,DSRL(深蓝方块)vs GRPO(紫色三角)在四种思维行为上的训练曲线:Subgoal / Enumeration / Verification / Backtracking。每个面板独立 y 轴 (0–8 / 0–8 / 0–6 / 0–18)。标记白边、点状紫灰网格、Times New Roman serif,顶部居中无边框图例。
@paper · 来自论文
PreRL: Pre-train-Anchored Reinforcement Learning for Language Models
PreRL:预训练锚定的语言模型强化学习
PreRL Authors · arXiv 2026
// original from paper · 论文原图

// reproduced via prerl_behavior_panels.py · 脚本复现download png
prerl_behavior_panels.py
"""1x4 horizontal line panels: cognitive-behavior counts vs training step.

Reproduces the `avg_count_panels` figure from the PreRL paper
(arXiv:2602.02488). Compares two RL methods (DSRL vs GRPO) across four
chain-of-thought behaviors (Subgoal Setting / Enumeration / Verification /
Backtracking) along the training trajectory.

Standalone: just `python prerl_behavior_panels.py`. All data is inline.
"""

import matplotlib.pyplot as plt
from matplotlib.lines import Line2D

# ──────────────────────────────────────────────────────────────────────
# Data (per-checkpoint average counts of each behavior).
# ──────────────────────────────────────────────────────────────────────
dsrl_step0 = {"step": 0, "backtracking": 1.167, "verification": 0.533,
              "subgoal": 1.233, "enumeration": 1.033}

dsrl = [
    dsrl_step0,
    {"step": 25,  "backtracking": 6.7,    "verification": 1.933, "subgoal": 3.0,   "enumeration": 3.133},
    {"step": 50,  "backtracking": 9.333,  "verification": 2.733, "subgoal": 4.9,   "enumeration": 4.1},
    {"step": 75,  "backtracking": 12.867, "verification": 3.4,   "subgoal": 5.7,   "enumeration": 5.4},
    {"step": 100, "backtracking": 13.6,   "verification": 3.133, "subgoal": 5.033, "enumeration": 5.067},
    {"step": 125, "backtracking": 11.267, "verification": 2.833, "subgoal": 3.233, "enumeration": 2.867},
    {"step": 150, "backtracking": 10.733, "verification": 2.767, "subgoal": 3.933, "enumeration": 3.4},
    {"step": 175, "backtracking": 14.433, "verification": 3.4,   "subgoal": 4.3,   "enumeration": 4.433},
    {"step": 200, "backtracking": 14.0,   "verification": 3.467, "subgoal": 4.633, "enumeration": 4.667},
    {"step": 225, "backtracking": 14.733, "verification": 4.267, "subgoal": 5.8,   "enumeration": 5.3},
    {"step": 250, "backtracking": 11.7,   "verification": 2.667, "subgoal": 5.2,   "enumeration": 4.467},
    {"step": 275, "backtracking": 13.533, "verification": 3.3,   "subgoal": 5.3,   "enumeration": 3.833},
]

grpo = [
    {"step": 0,   "backtracking": 1.167, "verification": 0.533, "subgoal": 1.233, "enumeration": 1.033},
    {"step": 25,  "backtracking": 2.667, "verification": 0.633, "subgoal": 1.267, "enumeration": 1.0},
    {"step": 50,  "backtracking": 4.3,   "verification": 1.233, "subgoal": 1.9,   "enumeration": 1.9},
    {"step": 75,  "backtracking": 6.667, "verification": 1.867, "subgoal": 2.9,   "enumeration": 3.033},
    {"step": 100, "backtracking": 7.533, "verification": 2.2,   "subgoal": 3.833, "enumeration": 4.267},
    {"step": 125, "backtracking": 7.7,   "verification": 1.667, "subgoal": 2.667, "enumeration": 2.6},
    {"step": 150, "backtracking": 7.467, "verification": 2.233, "subgoal": 4.3,   "enumeration": 4.033},
    {"step": 175, "backtracking": 7.233, "verification": 1.8,   "subgoal": 2.5,   "enumeration": 3.4},
    {"step": 200, "backtracking": 7.967, "verification": 2.267, "subgoal": 3.333, "enumeration": 3.467},
    {"step": 225, "backtracking": 8.067, "verification": 2.867, "subgoal": 3.5,   "enumeration": 3.567},
    {"step": 250, "backtracking": 8.533, "verification": 2.767, "subgoal": 3.7,   "enumeration": 3.433},
    {"step": 275, "backtracking": 9.1,   "verification": 2.167, "subgoal": 3.933, "enumeration": 3.0},
]

categories = [
    {"key": "subgoal",      "title": "Subgoal Setting",  "ymin": 0, "ymax": 8,  "yticks": [0, 2, 4, 6, 8]},
    {"key": "enumeration",  "title": "Enumeration",       "ymin": 0, "ymax": 8,  "yticks": [0, 2, 4, 6, 8]},
    {"key": "verification", "title": "Verification",      "ymin": 0, "ymax": 6,  "yticks": [0, 2, 4, 6]},
    {"key": "backtracking", "title": "Backtracking",      "ymin": 0, "ymax": 18, "yticks": [0, 3, 6, 9, 12, 15, 18]},
]

# ──────────────────────────────────────────────────────────────────────
# Style
# ──────────────────────────────────────────────────────────────────────
COL_GRPO = "#7b52ab"
COL_DSRL = "#2a6db5"
GRID_COL = "#d4d0e4"

plt.rcParams.update({
    "font.family":      "serif",
    "font.serif":       ["Times New Roman", "Times", "DejaVu Serif"],
    "font.weight":      "normal",
    "axes.titleweight": "normal",
    "axes.labelweight": "normal",
    "font.size":        11,
    "axes.titlesize":   13,
    "axes.labelsize":   11,
    "xtick.labelsize":  9.5,
    "ytick.labelsize":  9.5,
    "legend.fontsize":  11,
})

# ──────────────────────────────────────────────────────────────────────
# Figure (1×4 horizontal)
# ──────────────────────────────────────────────────────────────────────
fig, axes = plt.subplots(1, 4, figsize=(11, 3), facecolor="white")
fig.subplots_adjust(left=0.07, right=0.99, top=0.76, bottom=0.17, wspace=0.28)

steps_dsrl = [d["step"] for d in dsrl]
steps_grpo = [d["step"] for d in grpo]

for ax, cat in zip(axes, categories):
    key = cat["key"]
    y_dsrl = [d[key] for d in dsrl]
    y_grpo = [d[key] for d in grpo]

    ax.set_axisbelow(True)
    ax.yaxis.grid(True, color=GRID_COL, linewidth=0.8, linestyle=(0, (3, 4)))
    ax.xaxis.grid(True, color=GRID_COL, linewidth=0.8, linestyle=(0, (3, 4)))

    ax.plot(steps_grpo, y_grpo, color=COL_GRPO, linewidth=1.8,
            marker="^", markersize=6, markerfacecolor=COL_GRPO,
            markeredgecolor="white", markeredgewidth=0.8, zorder=3)
    ax.plot(steps_dsrl, y_dsrl, color=COL_DSRL, linewidth=1.8,
            marker="s", markersize=5.5, markerfacecolor=COL_DSRL,
            markeredgecolor="white", markeredgewidth=0.8, zorder=3)

    ax.set_xlim(-5, 285)
    ax.set_ylim(cat["ymin"], cat["ymax"])
    ax.set_yticks(cat["yticks"])
    ax.set_xticks([0, 50, 100, 150, 200, 250])

    for spine in ax.spines.values():
        spine.set_linewidth(0.8)

    ax.tick_params(axis="both", which="both", length=3, color="#9490a8",
                   labelcolor="#2e2b40", pad=3)
    ax.set_title(cat["title"], pad=8, color="#2e2b40")
    ax.set_xlabel("Training Steps", labelpad=5, color="#2e2b40")

axes[0].set_ylabel("Avg Count", labelpad=6, color="#2e2b40")
for ax in axes[1:]:
    ax.set_ylabel("")

# ──────────────────────────────────────────────────────────────────────
# Legend (top, gray box)
# ──────────────────────────────────────────────────────────────────────
legend_elements = [
    Line2D([0], [0], color=COL_GRPO, linewidth=1.8, marker="^", markersize=6,
           markerfacecolor=COL_GRPO, markeredgecolor="white", markeredgewidth=0.8,
           label="GRPO"),
    Line2D([0], [0], color=COL_DSRL, linewidth=1.8, marker="s", markersize=5.5,
           markerfacecolor=COL_DSRL, markeredgecolor="white", markeredgewidth=0.8,
           label="DSRL"),
]

leg = fig.legend(
    handles=legend_elements,
    loc="upper center", ncol=2,
    bbox_to_anchor=(0.5, 0.98),
    frameon=True, framealpha=1.0, edgecolor="#b8b4cc",
    fontsize=11, handlelength=2.2, columnspacing=2.0, handletextpad=0.6,
)
leg.get_frame().set_linewidth(0.9)

plt.savefig("avg_count_panels.png", dpi=300,
            bbox_inches="tight", facecolor="white")
print("Saved avg_count_panels.png")