Line Chart · 折线图#training-curve#marker-styles#monotonic-improvement#single-panel
OpenGame · 3-line plot of build / visual / intent vs debug iterations
OpenGame · 三指标(构建 / 视觉 / 意图)随调试迭代的折线图
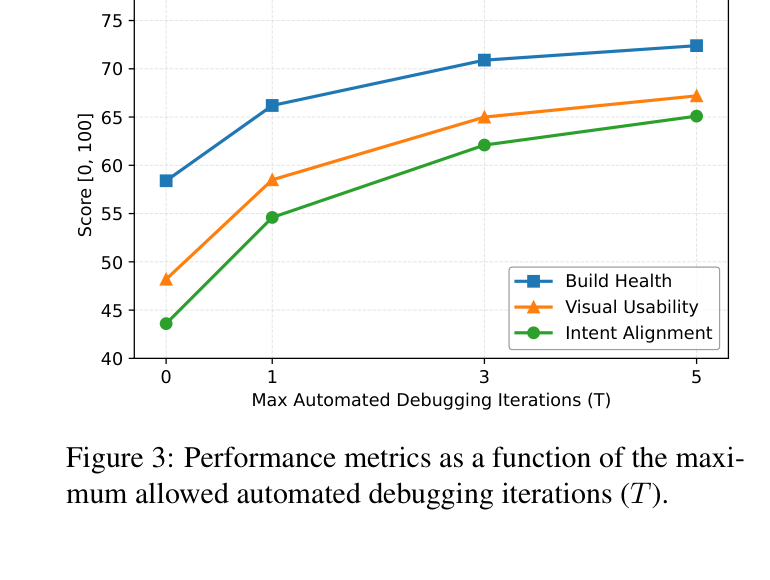
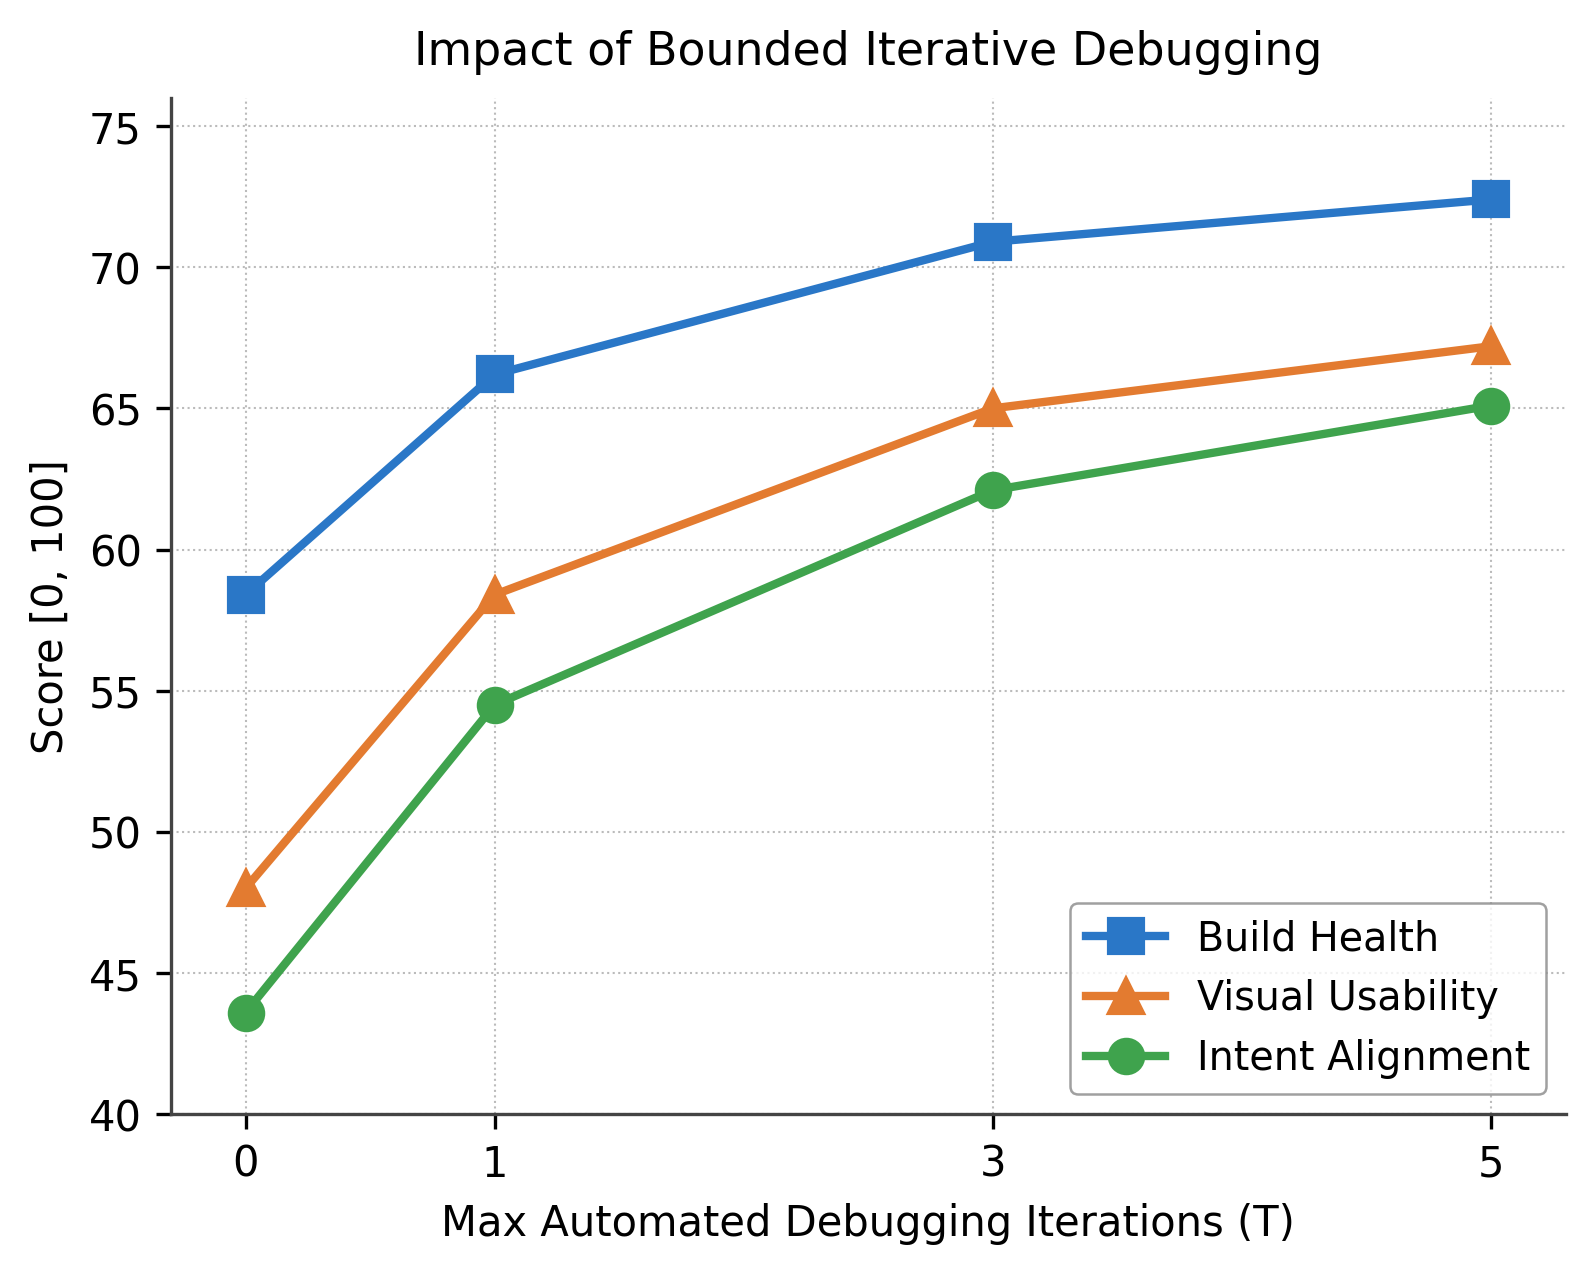
Reproduction of OpenGame Figure 3. Three lines (Build Health, Visual Usability, Intent Alignment) tracked across 4 levels of the maximum allowed automated debugging iterations T ∈ {0, 1, 3, 5}. Each line uses a distinct marker (square / triangle / circle) and color (blue / orange / green) and lands on a shared y-axis [40, 75]. Dotted minor grid, hidden top/right spines, lower-right legend with white frame.
OpenGame Figure 3 复现。三条折线(Build Health / Visual Usability / Intent Alignment),自变量为允许的自动调试迭代数 T ∈ {0, 1, 3, 5}。三条曲线分别用方/三角/圆形标记和蓝/橙/绿色,y 轴 [40, 75]。点状次网格,隐藏顶/右边框,右下角白底图例。
@paper · 来自论文
OpenGame: Open Agentic Coding for Games
OpenGame:面向游戏的开源 Agentic 编码
OpenGame Authors · arXiv 2026
// original from paper · 论文原图
// reproduced via opengame_debug_iters.py · 脚本复现download png
opengame_debug_iters.py
"""OpenGame · Three-line plot of Build / Visual / Intent metrics vs debug iterations.

Reproduction of OpenGame Figure 3 (Performance metrics as a function of
the maximum allowed automated debugging iterations T).
Source: OpenGame: Open Agentic Coding for Games, arXiv:2604.18394.

Three metrics are tracked on the same axis as T grows from 0 to 5:
  - Build Health  (square markers, blue)
  - Visual Usability  (triangle, orange)
  - Intent Alignment  (circle, green)
"""

import matplotlib.pyplot as plt
import numpy as np

plt.rcParams.update({
    "font.family": "sans-serif",
    "font.sans-serif": ["DejaVu Sans", "Arial"],
})

COLOR_BH = "#2A77C7"
COLOR_VU = "#E37B30"
COLOR_IA = "#3FA34D"

T = np.array([0, 1, 3, 5])
BUILD_HEALTH    = np.array([58.4, 66.2, 70.9, 72.4])
VISUAL_USABILITY = np.array([48.0, 58.4, 65.0, 67.2])
INTENT_ALIGN    = np.array([43.6, 54.5, 62.1, 65.1])

fig, ax = plt.subplots(figsize=(6.0, 4.4))

ax.plot(T, BUILD_HEALTH, color=COLOR_BH, lw=2.0, marker="s", ms=8,
        mfc=COLOR_BH, mec=COLOR_BH, label="Build Health")
ax.plot(T, VISUAL_USABILITY, color=COLOR_VU, lw=2.0, marker="^", ms=8,
        mfc=COLOR_VU, mec=COLOR_VU, label="Visual Usability")
ax.plot(T, INTENT_ALIGN, color=COLOR_IA, lw=2.0, marker="o", ms=8,
        mfc=COLOR_IA, mec=COLOR_IA, label="Intent Alignment")

ax.set_title("Impact of Bounded Iterative Debugging", fontsize=11, pad=8)
ax.set_xlabel("Max Automated Debugging Iterations (T)", fontsize=10)
ax.set_ylabel("Score [0, 100]", fontsize=10)

ax.set_xticks(T)
ax.set_xlim(-0.3, 5.3)
ax.set_ylim(40, 76)
ax.yaxis.set_major_locator(plt.MultipleLocator(5))

ax.grid(True, ls=":", lw=0.5, color="#bbb", zorder=0)
ax.set_axisbelow(True)
for sp in ("top", "right"):
    ax.spines[sp].set_visible(False)
for sp in ("left", "bottom"):
    ax.spines[sp].set_color("#444")

leg = ax.legend(loc="lower right", fontsize=9.5, frameon=True,
                edgecolor="#888")
leg.get_frame().set_linewidth(0.6)

plt.savefig("opengame_debug_iters.png", dpi=300, bbox_inches="tight",
            facecolor="white")
plt.close()
print("saved: opengame_debug_iters.png")