Line Chart · 折线图#loss-curve#axis-arrows#L-spine#inset-zoom#latex
SiameseNorm · Loss curve with arrow axes and zoom inset
SiameseNorm · L 形 spine 损失曲线 + 局部放大子图
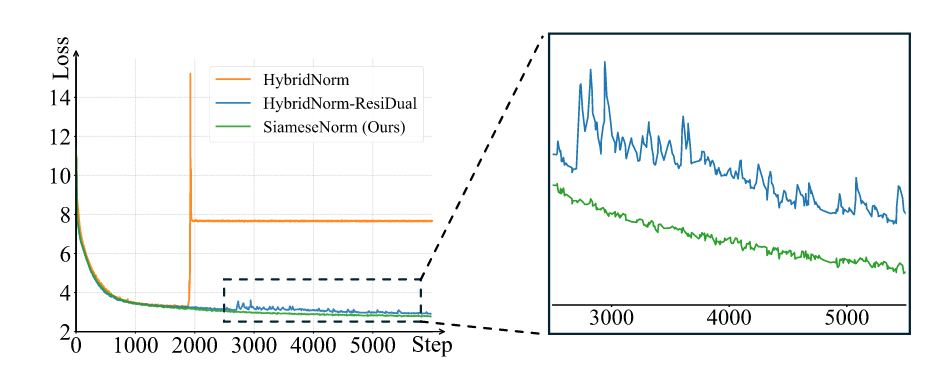
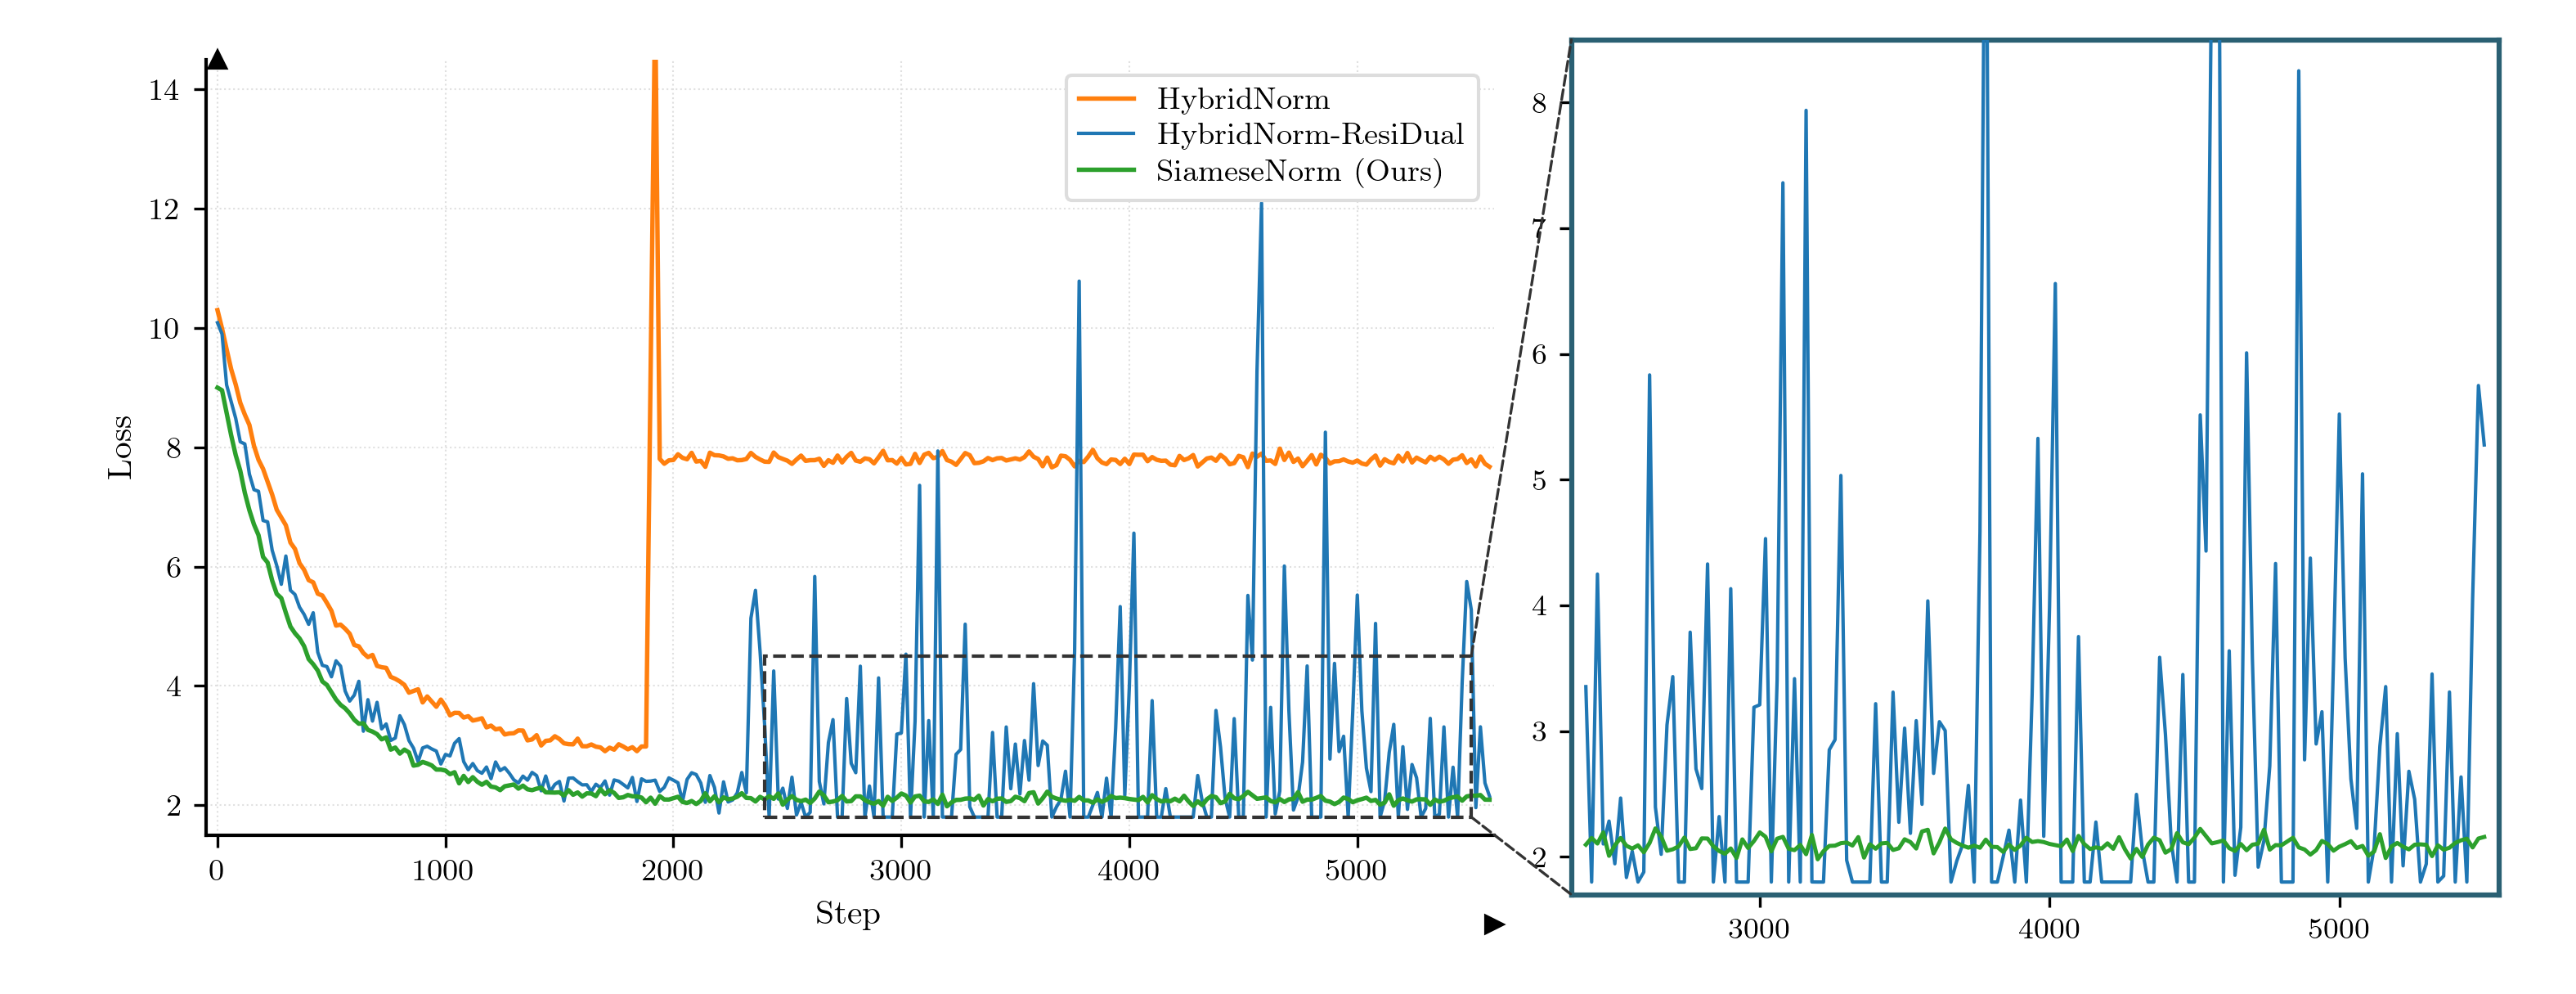
Pre-training loss for three norm variants. The main panel uses an L-shape spine (left + bottom only) with arrow tips at both axis ends, dotted grid, and a dashed zoom rectangle on the right tail. A right-side inset panel re-plots the zoomed region with a dark-teal frame, connected to the rectangle by black dashed leader lines. tab10 colours, LaTeX serif font.
三种 norm 变体的预训练损失曲线。主图用 L 形 spine(仅左 + 下)+ 轴端箭头 + 点状网格,右侧用虚线矩形圈出尾部放大区,独立的右侧 inset 子图(深青边框)通过黑色虚线引线连过去。tab10 配色,LaTeX serif 字体。
@paper · 来自论文
SiameseNorm: Breaking the Barrier to Reconciling Pre/Post-Norm
SiameseNorm:打破 Pre-Norm 与 Post-Norm 协同训练的屏障
Tsinghua Leap Lab & Alibaba Qwen Applications · arXiv 2025
// original from paper · 论文原图
// reproduced via line_loss_inset.py · 脚本复现download png
line_loss_inset.py
"""
Reproduce: image10.png — Loss curve with zoom inset (SiameseNorm paper style)
Main plot: L-shaped spine (left+bottom) + axis arrows, 3 lines.
Inset: zoomed blue+green in right panel.
Style: serif, tab10 colors, black dashed connection lines.
"""

import numpy as np
import matplotlib.pyplot as plt
import matplotlib.patches as mpatches
from matplotlib.patches import ConnectionPatch, FancyArrowPatch
from mpl_toolkits.axes_grid1.inset_locator import mark_inset, inset_axes

plt.rcParams.update({
    'text.usetex': True,
    'font.family': 'serif',
    'font.serif': ['Computer Modern Roman', 'STIX Two Text', 'DejaVu Serif'],
    'axes.unicode_minus': False,
})

rng = np.random.default_rng(7)

# ---- 模拟数据 ----
steps = np.arange(0, 5600, 20)

# HybridNorm (orange): exponential decay to ~8, spike at ~1900, then flat ~8
y_hybrid = 7.5 * np.exp(-steps / 450) + 2.8
y_hybrid += rng.normal(0, 0.06, len(steps))
spike_idx = np.searchsorted(steps, 1880)
spike_end = np.searchsorted(steps, 1940)
y_hybrid[spike_idx:spike_end] = np.linspace(y_hybrid[spike_idx - 1], 15.5, spike_end - spike_idx)
after_spike = np.searchsorted(steps, 1940)
y_hybrid[after_spike:] = 7.8 + rng.normal(0, 0.07, len(steps[after_spike:]))

# HybridNorm-ResiDual (blue): rapid decay + noisy with prominent spikes
y_blue = 7.8 * np.exp(-steps / 380) + 2.3
y_blue += rng.normal(0, 0.18, len(steps))
mask_noisy = steps > 2300
# 模拟蓝线在 2300+ 之后有明显峰值(与原图一致)
noise_large = rng.normal(0, 1.5, mask_noisy.sum())
# 少量极值峰
for idx_offset in rng.integers(10, mask_noisy.sum() - 10, size=8):
    noise_large[idx_offset] += rng.uniform(4, 9)
y_blue[mask_noisy] += noise_large
y_blue = np.clip(y_blue, 1.8, 13.5)

# SiameseNorm/Ours (green): smooth rapid decay
y_green = 7.2 * np.exp(-steps / 360) + 2.1
y_green += rng.normal(0, 0.05, len(steps))
y_green = np.clip(y_green, 1.8, 9.0)

# tab10 colors
C_ORANGE = '#FF7F0E'
C_BLUE   = '#1F77B4'
C_GREEN  = '#2CA02C'

# ---- 主图 ----
# 原图 952×368 → 宽高比 2.59;复现目标 10.5×4.05"
fig = plt.figure(figsize=(10.5, 4.05))
ax_main = fig.add_axes([0.08, 0.16, 0.50, 0.78])

ax_main.plot(steps, y_hybrid, color=C_ORANGE, lw=1.3, label='HybridNorm', zorder=3)
ax_main.plot(steps, y_blue,   color=C_BLUE,   lw=1.0, label='HybridNorm-ResiDual', zorder=3)
ax_main.plot(steps, y_green,  color=C_GREEN,  lw=1.3, label='SiameseNorm (Ours)', zorder=4)

ax_main.set_xlim(-50, 5600)
ax_main.set_ylim(1.5, 14.5)   # 与原图 ~2-14 对齐
ax_main.set_xlabel(r'Step', fontsize=10)
ax_main.set_ylabel(r'Loss', fontsize=10)
ax_main.set_xticks([0, 1000, 2000, 3000, 4000, 5000])
ax_main.tick_params(labelsize=9.0, direction='out', length=3.5, width=0.8)

# L 形 spine(左+下),无上右
ax_main.spines['top'].set_visible(False)
ax_main.spines['right'].set_visible(False)
ax_main.spines['left'].set_linewidth(1.0)
ax_main.spines['bottom'].set_linewidth(1.0)

# 轴端箭头(模拟原图的箭头轴)
ax_main.plot(1, 0, '>k', transform=ax_main.get_yaxis_transform(),
             clip_on=False, markersize=5)
ax_main.plot(0, 1, '^k', transform=ax_main.get_xaxis_transform(),
             clip_on=False, markersize=5)

ax_main.grid(True, color='#E0E0E0', linewidth=0.5, linestyle=':')
ax_main.set_axisbelow(True)

leg = ax_main.legend(
    loc='upper right',
    fontsize=9.0,
    frameon=True,
    facecolor='white',
    edgecolor='#DDDDDD',
    borderpad=0.4,
    labelspacing=0.25,
    handlelength=1.8,
    framealpha=1.0,
)

# ---- Zoom 区域(虚线矩形)----
zoom_x1, zoom_x2 = 2400, 5500
zoom_y1, zoom_y2 = 1.8, 4.5
rect = mpatches.FancyBboxPatch(
    (zoom_x1, zoom_y1),
    zoom_x2 - zoom_x1, zoom_y2 - zoom_y1,
    boxstyle='square,pad=0',
    linewidth=1.0, edgecolor='#333333',
    facecolor='none', linestyle='--',
    zorder=5,
)
ax_main.add_patch(rect)

# ---- Inset(右侧独立子图,原图约占总宽 40%,紧凑)----
ax_inset = fig.add_axes([0.61, 0.10, 0.36, 0.86])

mask_z = (steps >= zoom_x1) & (steps <= zoom_x2)
steps_z = steps[mask_z]

ax_inset.plot(steps_z, y_blue[mask_z],  color=C_BLUE,  lw=1.0, zorder=3)
ax_inset.plot(steps_z, y_green[mask_z], color=C_GREEN, lw=1.2, zorder=4)

ax_inset.set_xlim(zoom_x1 - 50, zoom_x2 + 50)
ax_inset.set_ylim(zoom_y1 - 0.1, zoom_y2 + 4.0)   # 原图 inset y: ~1.8~8.5
ax_inset.set_xticks([3000, 4000, 5000])
ax_inset.tick_params(labelsize=8.5, direction='out', length=3.5, width=0.8)

for sp in ax_inset.spines.values():
    sp.set_visible(True)
    sp.set_linewidth(1.5)
    sp.set_color('#2A6073')   # 原图 inset 边框为深蓝灰色

ax_inset.grid(False)

# ---- 黑色虚线连接线(从 zoom 框的两个角到 inset 边缘)----
# 右上角 → inset 左上角
con1 = ConnectionPatch(
    xyA=(zoom_x2, zoom_y2), coordsA=ax_main.transData,
    xyB=(ax_inset.get_xlim()[0], ax_inset.get_ylim()[1]),
    coordsB=ax_inset.transData,
    color='#333333', lw=0.8, linestyle='--',
)
# 右下角 → inset 左下角
con2 = ConnectionPatch(
    xyA=(zoom_x2, zoom_y1), coordsA=ax_main.transData,
    xyB=(ax_inset.get_xlim()[0], ax_inset.get_ylim()[0]),
    coordsB=ax_inset.transData,
    color='#333333', lw=0.8, linestyle='--',
)
fig.add_artist(con1)
fig.add_artist(con2)

fig.savefig(
    'line_loss_inset_repro.png',
    dpi=300, facecolor='white',
)
plt.close(fig)
print('saved: line_loss_inset_repro.png')