Bar Chart · 柱状图#paired-bars#delta-annotation#serif#two-panel
MemEvolve · Paired baseline-vs-method bars with delta arrows
MemEvolve · 配对柱 + 增益箭头
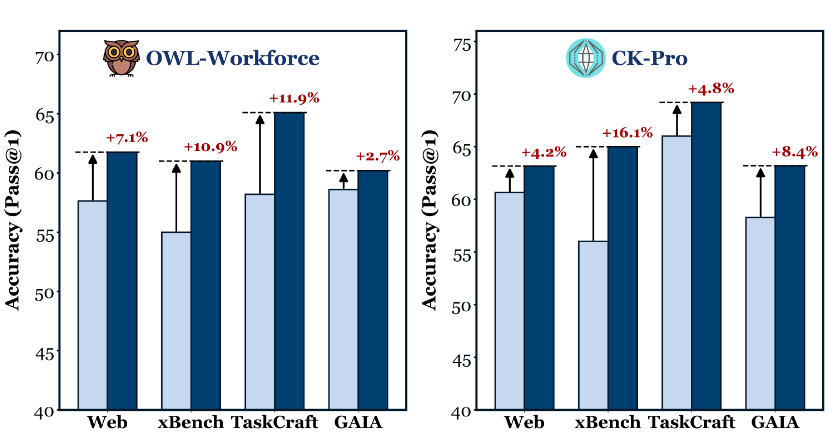
Two-panel paper figure with paired baseline / method bars. Each pair has a black dashed reference line at the baseline height, an upward arrow to the method bar, and a bold red percentage delta. Serif font, fully boxed axes, soft sky-blue + navy palette.
双子图配对柱状图:每组先画基线柱,再画方法柱,并用黑色虚线 + 上行箭头 + 粗体红色百分比标注增益。serif 字体,四边框,浅钢蓝 + 海军蓝配色。
@paper · 来自论文
MemEvolve: Meta-Evolution of Agent Memory Systems
MemEvolve:智能体记忆系统的元进化
Guibin Zhang et al. · arXiv 2025
// original from paper · 论文原图
// reproduced via bar_memevolve.py · 脚本复现download png
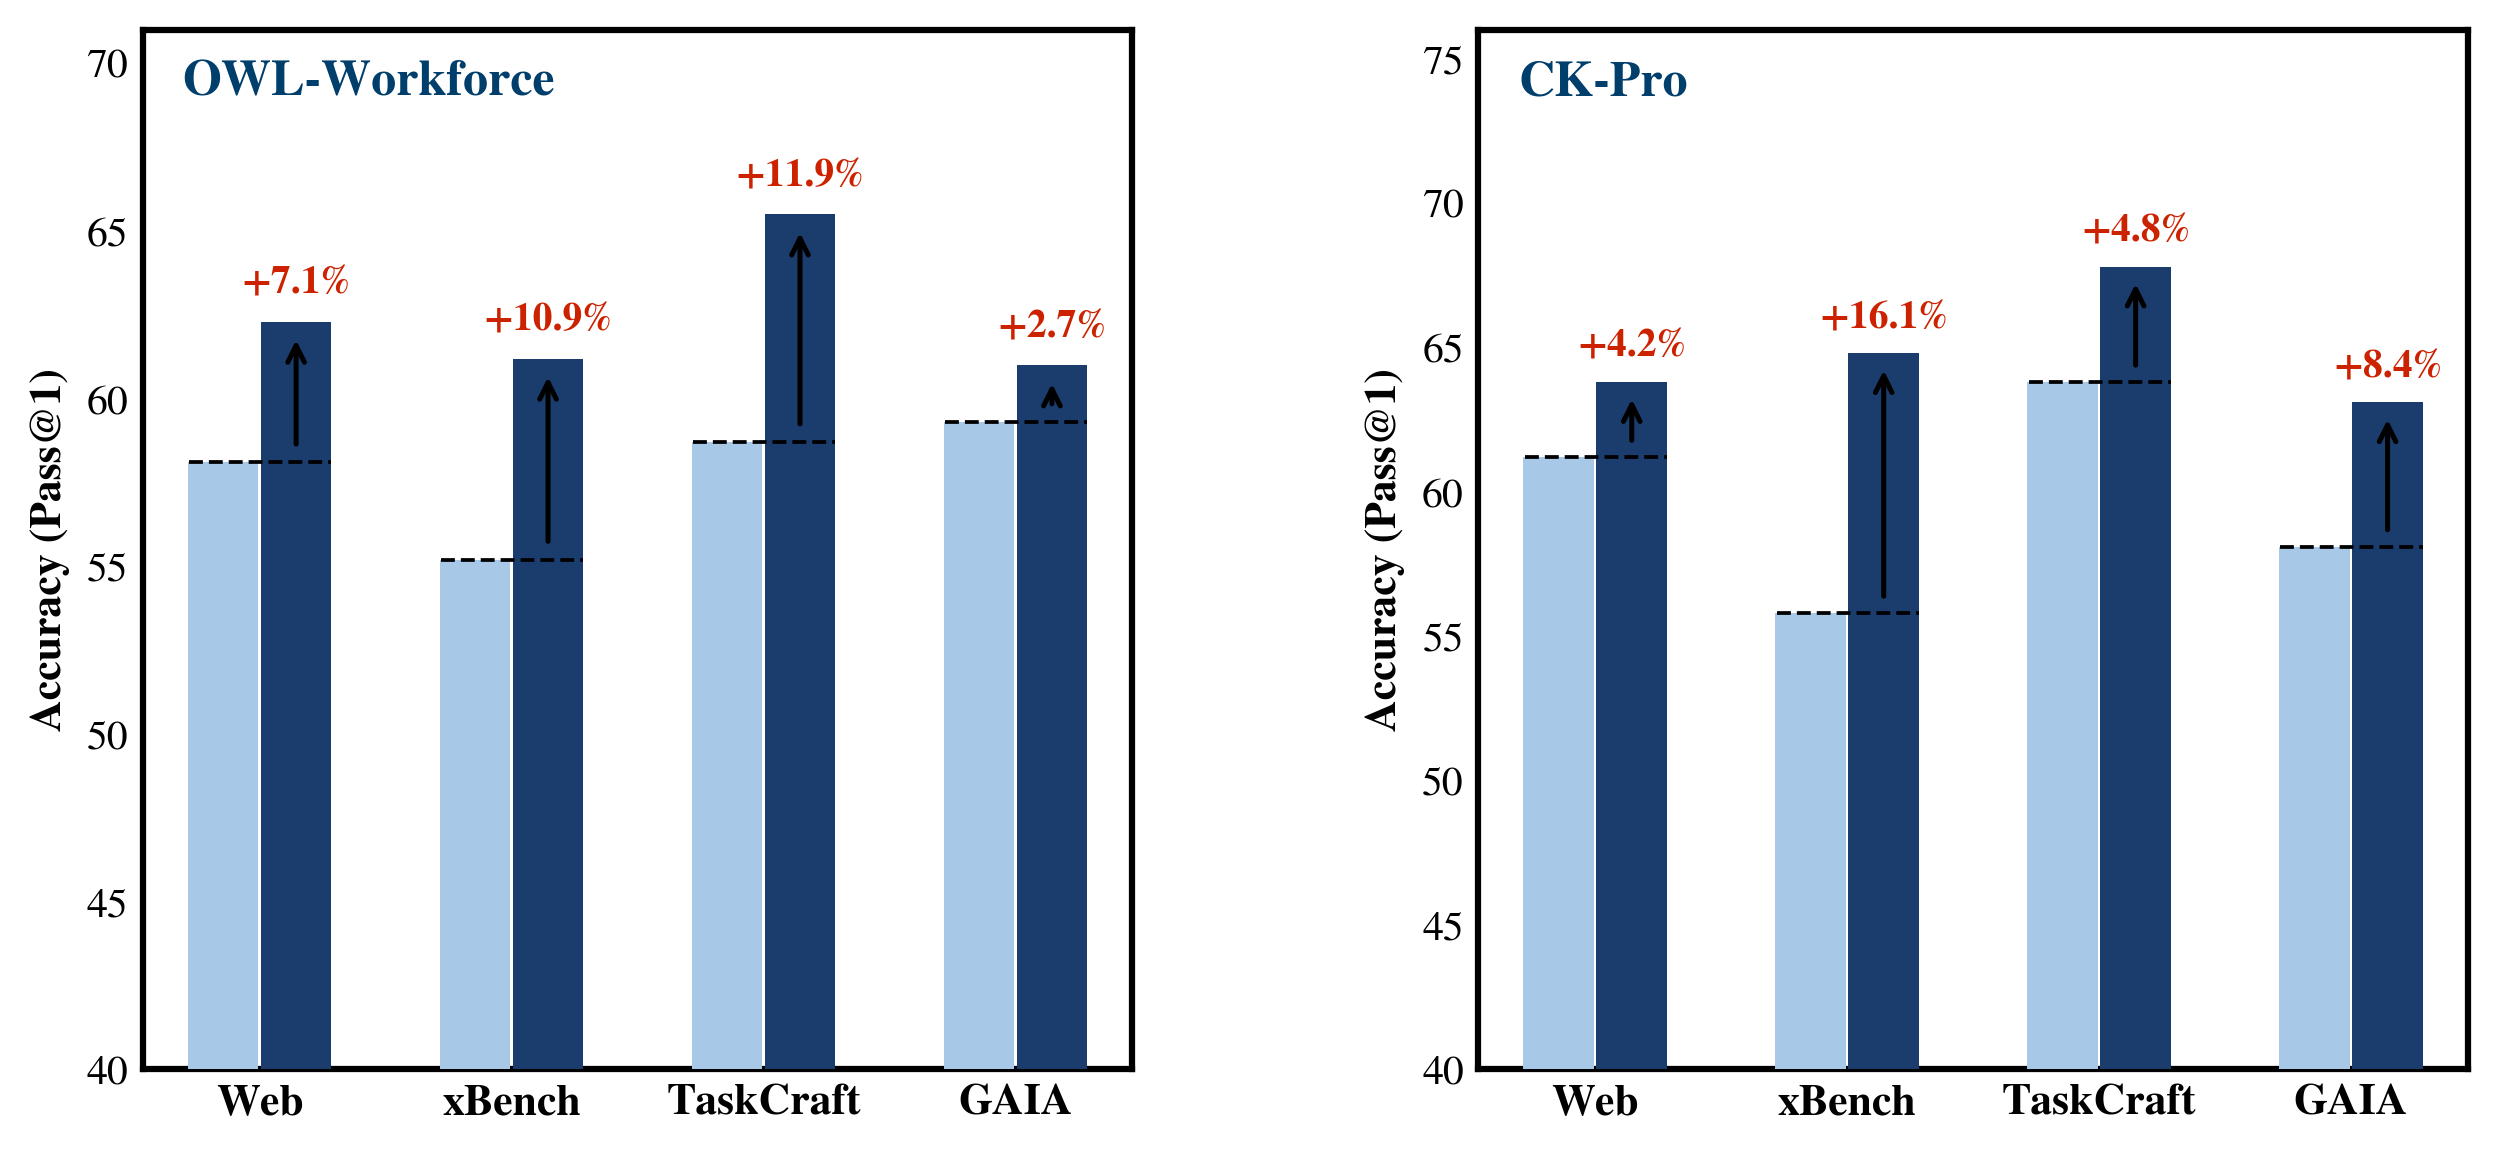
bar_memevolve.py
"""
复现 image1: MemEvolve 论文风格柱状图
特征:配对柱(baseline vs method)+ 箭头 + 红色百分比标注 + 虚线参考线
来源:MemEvolve: Meta-Evolution of Agent Memory Systems
"""

import matplotlib.pyplot as plt
import matplotlib.patches as mpatches
import matplotlib.ticker as ticker
import numpy as np

# ── 预分析结论 ─────────────────────────────────────────────
# 字体:serif,双层 'a',衬线精细 → Computer Modern 风格
#       matplotlib 中最接近的可用字体:STIXGeneral / DejaVu Serif
# 加粗:标题(bold) | 增益标注(bold) | 轴标签/刻度(normal)
# 间距:两柱紧贴,gap≈0,柱宽约占 group 的 28%
# 分辨率:300 dpi
plt.rcParams.update({
    'font.family': 'serif',
    'font.serif': ['STIXGeneral', 'DejaVu Serif', 'Times New Roman'],
    'mathtext.fontset': 'stix',
})

# ── 颜色系统 ──────────────────────────────────────────────
COLOR_BASELINE = '#A8C8E8'   # 浅钢蓝,baseline 柱
COLOR_METHOD   = '#1B3D6E'   # 深海军蓝,method 柱
COLOR_DELTA    = '#CC2200'   # 红色,标注增益

# ── 数据 ─────────────────────────────────────────────────
panels = [
    {
        'title': 'OWL-Workforce',   # emoji 字体不支持,用文字替代
        'groups': ['Web', 'xBench', 'TaskCraft', 'GAIA'],
        'baseline': [58.1, 55.2, 58.7, 59.3],
        'method':   [62.3, 61.2, 65.5, 61.0],
        'delta':    ['+7.1%', '+10.9%', '+11.9%', '+2.7%'],
        'ylim':     (40, 71),   # 原图左图 Y 轴 40-70
    },
    {
        'title': 'CK-Pro',
        'groups': ['Web', 'xBench', 'TaskCraft', 'GAIA'],
        'baseline': [61.2, 55.8, 63.8, 58.1],
        'method':   [63.8, 64.8, 67.8, 63.1],
        'delta':    ['+4.2%', '+16.1%', '+4.8%', '+8.4%'],
        'ylim':     (40, 76),   # 原图右图 Y 轴 40-75
    },
]

# ── 画布 ─────────────────────────────────────────────────
fig, axes = plt.subplots(1, 2, figsize=(10, 4.5), sharey=False)
fig.subplots_adjust(wspace=0.35)

BAR_W    = 0.28
GAP      = 0.01      # 两柱几乎紧贴(原图约为 0)
ARROW_KW = dict(arrowstyle='->', color='black', lw=1.2)

for ax, panel in zip(axes, panels):
    groups   = panel['groups']
    baseline = np.array(panel['baseline'])
    method   = np.array(panel['method'])
    delta    = panel['delta']
    n        = len(groups)
    x        = np.arange(n)

    # 柱体
    bars_b = ax.bar(x - (BAR_W + GAP) / 2, baseline, width=BAR_W,
                    color=COLOR_BASELINE, zorder=3)
    bars_m = ax.bar(x + (BAR_W + GAP) / 2, method,   width=BAR_W,
                    color=COLOR_METHOD,   zorder=3)

    # 虚线参考线(baseline 高度)
    for i, (bl, me) in enumerate(zip(baseline, method)):
        # 水平虚线从 baseline 柱顶延伸到 method 柱顶
        ax.plot([x[i] - BAR_W, x[i] + BAR_W + GAP / 2],
                [bl, bl], color='black', lw=0.9, ls='--', zorder=4)

        # 箭头(baseline 顶 → method 顶)
        ax.annotate('', xy=(x[i] + (BAR_W + GAP) / 2, me - 0.3),
                    xytext=(x[i] + (BAR_W + GAP) / 2, bl + 0.3),
                    arrowprops=ARROW_KW, zorder=5)

        # 红色百分比标注
        ax.text(x[i] + (BAR_W + GAP) / 2, me + 0.6,
                delta[i], color=COLOR_DELTA,
                ha='center', va='bottom', fontsize=9.5, fontweight='bold')

    # 轴装饰:原图轴标签明显加粗
    ax.set_xticks(x)
    ax.set_xticklabels(groups, fontsize=10.5, fontweight='bold')
    ax.set_ylabel('Accuracy (Pass@1)', fontsize=10.5, fontweight='bold')
    ax.set_ylim(*panel['ylim'])
    ax.yaxis.set_major_locator(plt.MultipleLocator(5))

    # 四边框全显,线宽偏厚(原图有明显框线)
    for spine in ax.spines.values():
        spine.set_linewidth(1.5)
        spine.set_color('black')
    ax.tick_params(length=0)
    ax.set_axisbelow(True)

    # 标题(左上角):粗体 serif,颜色深蓝对应原图
    ax.text(0.04, 0.97, panel['title'], transform=ax.transAxes,
            fontsize=12, fontweight='bold', va='top', ha='left',
            color='#003F6C', fontfamily='serif')

plt.savefig('bar_memevolve_repro.png',
            dpi=300, bbox_inches='tight', facecolor='white')
plt.close()
print('saved: bar_memevolve_repro.png')