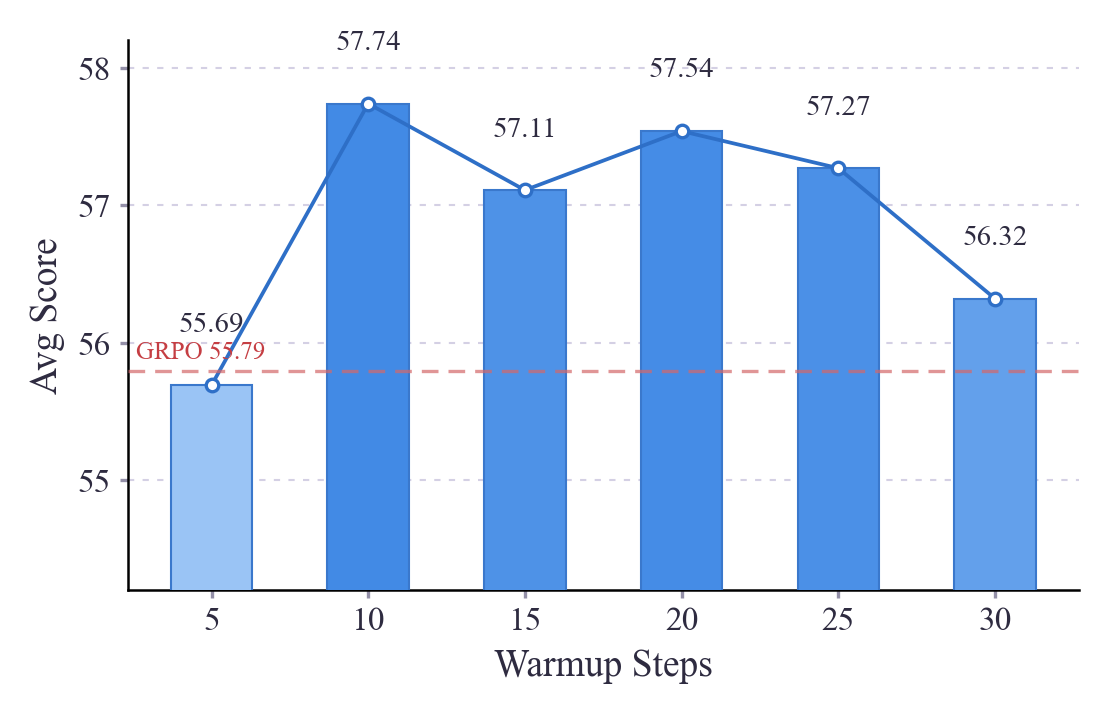
Average Scores Across Warmup Steps
不同预热步骤的平均分
This bar chart displays average scores across different warmup steps, with a trend line indicating score progression. The bars are colored using a gradient, and value labels are placed above each bar.
该柱状图显示了不同预热步骤的平均分,趋势线指示分数变化。柱子使用渐变色填充,数值标签位于每个柱子上方。
@paper · 来自论文
From $P(y|x)$ to $P(y)$: Investigating Reinforcement Learning in Pre-train Space
Yuqiao Tan, Minzheng Wang, Bo Liu, Zichen Liu, Tian Liang, Shizhu He, Jun Zhao, Kang Liu · arXiv:cs.LG 2026
While reinforcement learning with verifiable rewards (RLVR) significantly enhances LLM reasoning by optimizing the conditional distribution P(y|x), its potential is fundamentally bounded by the base model's existing output distribution. Optimizing the marginal distribution P(y) in the Pre-train Space addresses this bottleneck by encoding reasoning ability and preserving broad exploration capacity. Yet, conventional pre-training relies on static corpora for passive learning, leading to a distribution shift that hinders targeted reasoning enhancement. In this paper, we introduce PreRL (Pre-train Space RL), which applies reward-driven online updates directly to P(y). We theoretically and empirically validate the strong gradient alignment between log P(y) and log P(y|x), establishing PreRL as a viable surrogate for standard RL. Furthermore, we uncover a critical mechanism: Negative Sample Reinforcement (NSR) within PreRL serves as an exceptionally effective driver for reasoning. NSR-PreRL rapidly prunes incorrect reasoning spaces while stimulating endogenous reflective behaviors, increasing transition and reflection thoughts by 14.89x and 6.54x, respectively. Leveraging these insights, we propose Dual Space RL (DSRL), a Policy Reincarnation strategy that initializes models with NSR-PreRL to expand the reasoning horizon before transitioning to standard RL for fine-grained optimization. Extensive experiments demonstrate that DSRL consistently outperforms strong baselines, proving that pre-train space pruning effectively steers the policy toward a refined correct reasoning subspace.

import matplotlib.pyplot as plt
import numpy as np
from matplotlib.colors import LinearSegmentedColormap, to_hex

# ── Data ──────────────────────────────────────────────────────────────────────
warmup_steps = [5, 10, 15, 20, 25, 30]
avg_scores   = [55.69, 57.74, 57.11, 57.54, 57.27, 56.32]

# ── Style ─────────────────────────────────────────────────────────────────────
COL_START = "#9AC4F5"      # 柱子浅蓝
COL_END   = "#428AE5"      # 柱子深蓝
COL_LINE  = "#2E6FC7"      # 折线更深
GRID_COL  = "#d4d0e4"

plt.rcParams.update({
    "font.family":      "serif",
    "font.serif":       ["Times New Roman", "Times", "DejaVu Serif"],
    "font.size":         9,
    "axes.labelsize":    9,
    "xtick.labelsize":   8,
    "ytick.labelsize":   8,
})

# ── Figure ────────────────────────────────────────────────────────────────────
fig, ax = plt.subplots(figsize=(3.6, 2.3), facecolor="white")

x = np.arange(len(warmup_steps))
bar_width = 0.52

# Non-linear color mapping: compress high scores together, stretch low scores apart.
score_min, score_max = min(avg_scores), max(avg_scores)
if score_max > score_min:
    score_norm = [((s - score_min) / (score_max - score_min)) ** 0.4 for s in avg_scores]
else:
    score_norm = [0.5] * len(avg_scores)

bar_cmap = LinearSegmentedColormap.from_list("bar_grad", [COL_START, COL_END])
colors = [to_hex(bar_cmap(v)) for v in score_norm]

# Bars
bars = ax.bar(x, avg_scores, width=bar_width, color=colors,
              edgecolor="#3A78CC", linewidth=0.5, zorder=3)

# Trend line on top
ax.plot(x, avg_scores, color=COL_LINE, linewidth=0.9,
        marker="o", markersize=3, markerfacecolor="white",
        markeredgecolor=COL_LINE, markeredgewidth=0.8, zorder=4)

# Value labels (above the trend line)
for bar, val in zip(bars, avg_scores):
    ax.text(bar.get_x() + bar.get_width() / 2, val + 0.35,
            f"{val:.2f}", ha="center", va="bottom", fontsize=7,
            color="#2e2b40", zorder=5)

# GRPO baseline
ax.axhline(y=55.79, color="#D4686A", linewidth=0.8, linestyle=(0, (5, 3)), zorder=102, alpha=0.7)
ax.text(x[0] - 0.48, 55.79 + 0.05, "GRPO 55.79", va="bottom", ha="left",
        fontsize=6, color="#C53E43", zorder=10)

# Grid
ax.set_axisbelow(True)
ax.yaxis.grid(True, color=GRID_COL, linewidth=0.5, linestyle=(0, (3, 4)))

# Axes
ax.set_xticks(x)
ax.set_xticklabels([str(s) for s in warmup_steps])
ax.set_xlabel("Warmup Steps", labelpad=3, color="#2e2b40")
ax.set_ylabel("Avg Score", labelpad=3, color="#2e2b40")
ax.set_ylim(54.2, 58.2)
ax.set_yticks([55, 56, 57, 58])

# Spines
for spine in ax.spines.values():
    spine.set_linewidth(0.6)
ax.spines["top"].set_visible(False)
ax.spines["right"].set_visible(False)

ax.tick_params(axis="both", length=2, color="#9490a8",
               labelcolor="#2e2b40", pad=2)

plt.tight_layout(pad=0.4)
plt.savefig("./fig/warmup_ablation.pdf", dpi=300, bbox_inches="tight", facecolor="white")
plt.savefig("./fig/warmup_ablation.png", dpi=300, bbox_inches="tight", facecolor="white")
print("Saved warmup_ablation.pdf / .png")
plt.show()